Plotting graphs
Plotting the graphical model can be very beneficial for debugging the model.
Users are advised to begin with a model that contains fewer nodes, so that the graph is easier to visualize.
We have set up standard plotting routines with GraphMakie.jl and GraphPlot.jl, via package extensions.
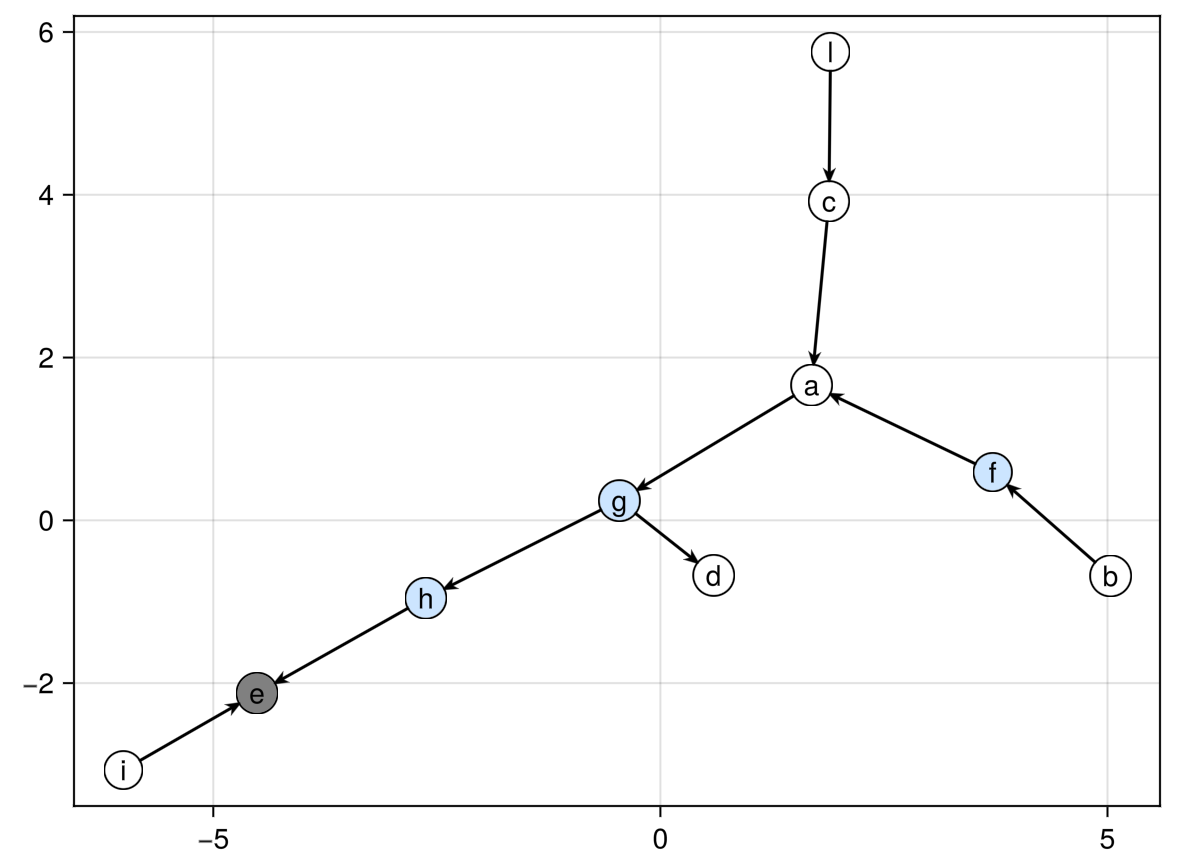
Observed nodes are colored in gray, unobserved nodes are colored in white, and deterministic nodes are colored in light blue.
model_def = @bugs begin
    a ~ dnorm(f, c)
    f = b - 1
    b ~ dnorm(0, 1)
    c ~ dnorm(l, 1)
    g = a * 2
    d ~ dnorm(g, 1)
    h = g + 2
    e ~ dnorm(h, i)
    i ~ dnorm(0, 1)
    l ~ dnorm(0, 1)
end

data = (
    e = 5.0,
)

inits = (
    a = 1.0,
    b = 2.0,
    c = 3.0,
    d = 4.0,
    i = 4.0,
    l = -2.0,
)

model = compile(model_def, data, inits)
GraphPlot.jl
using GraphPlot
gplot(model)
GraphMakie.jl
using GLMakie, GraphMakie
graphplot(model)